Analytics
Analytics is the numbers view of your workspace: how much is being said, by how many people, in how many conversations, and when.
Analytics is available to workspace administrators only.
| Platform | How to get there |
|---|---|
| Web | Open Settings from the sidebar, then Analytics |
| iOS and Android | Open the Admin tab, then Analytics |
Everything here is an aggregate for the whole workspace. Two of the cards name individuals, but they are read-only leaderboards — there is nothing to select, and no way to open a person and see what they did. If you need a per-action trail, HushChat cannot show you one; see What Analytics is not at the bottom of this page.
Choosing the period
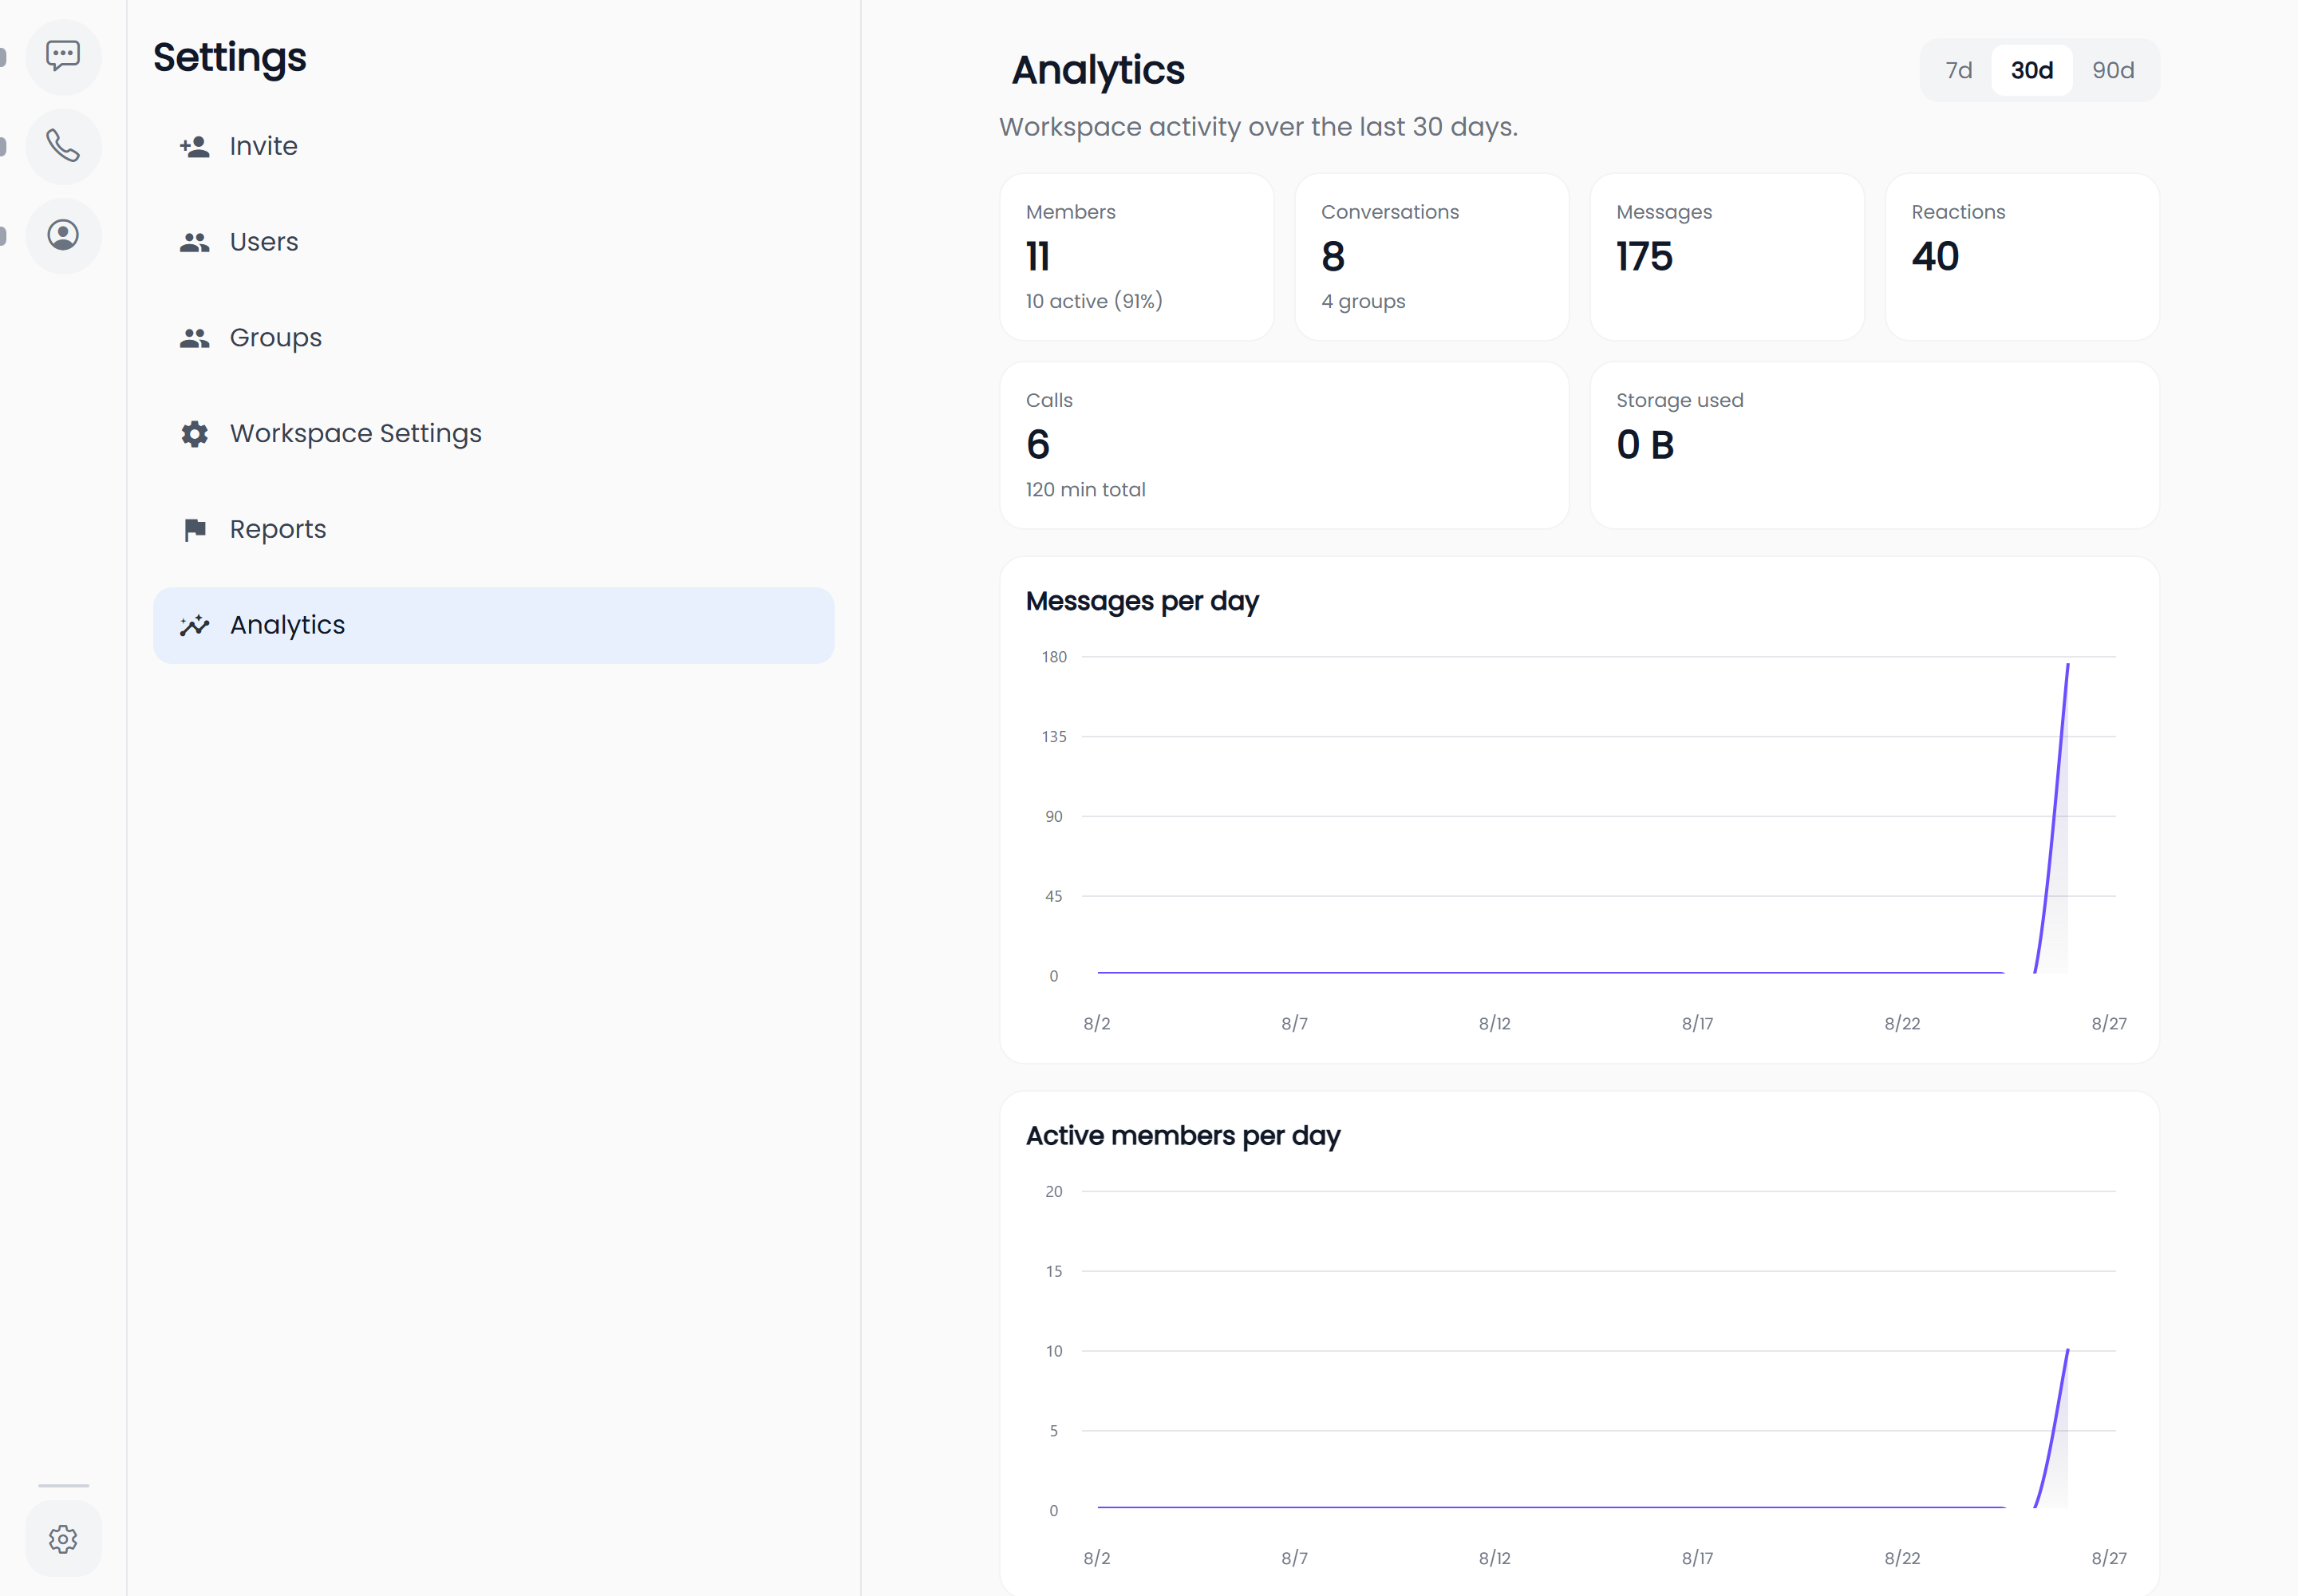
Three ranges sit at the top right of the screen, beside the Analytics heading:
| Range | Covers |
|---|---|
| 7d | the last 7 days |
| 30d | the last 30 days — the default |
| 90d | the last 90 days |
There is no custom range and no date picker. Those three buttons are the whole control. The line under the heading always states which one you are looking at:
"Workspace activity over the last 30 days."
Selecting a different range reloads every figure and chart on the page. If the data cannot be fetched the page reads "Couldn't load analytics. Pull to retry or try again later."
The six figures at the top
| Tile | What it counts |
|---|---|
| Members | Everyone in the workspace, with "N active (P%)" underneath — how many of them sent a message in the period |
| Conversations | Every conversation in the workspace, with "N groups" underneath |
| Messages | Messages sent during the period |
| Reactions | Reactions added during the period |
| Calls | Calls made during the period, with "N min total" underneath |
| Storage used | What the workspace's uploads occupy in total |
Members, Conversations and Storage used are running totals for the workspace as it stands today — they are not affected by the range you pick. Messages, Reactions and Calls count only what happened inside the chosen period.
The "% vs prev" comparison
Messages, Reactions and Calls each carry a small up or down arrow and a figure reading "12% vs prev".
Prev means the equal-length window immediately before the one you are looking at. On the 30-day range you are being compared with the 30 days before those; on 7d with the previous 7 days; on 90d with the previous 90. It is not last month, and not the same period a year ago.
The comparison is left off entirely when the previous window had nothing in it to compare against, and anything past 999% is shown as 999+.
The charts
Below the tiles, one card per question, in this order:
| Card | What it shows |
|---|---|
| Messages per day | A daily trend line across the whole range. Point at a day for its exact count. |
| Active members per day | How many different people sent something each day. |
| Most active conversations | The busiest conversations in the period, as a ranked bar list. |
| Most active members | The people who sent the most messages, as a ranked bar list. |
| Message types | A donut splitting messages by kind — Text, Attachments, Bot. |
| Busiest times (messages by day & hour) | A grid of the seven days against the 24 hours, darker where more was said. |
| Calls per day | Daily call counts as bars. |
| Call outcomes | A donut splitting calls into Answered, Missed, Declined and Cancelled. |
| Reactions | Which reactions were used, ranked — 👍 Thumbs up, ❤️ Love, 😂 Haha, 😮 Wow, 😢 Sad, 😠 Angry. |
| New conversations per day | Conversations started each day, as bars. |
| New members per week | People who joined each week, as bars. |
The two ranked lists show the top eight only, not everybody. A conversation with no name — a one-to-one chat — is listed as Direct chat, and a person with no name as Unknown user.
Automatic notices — someone joined, someone left, a call started — are excluded from every message figure on this page: the Messages tile, both per-day trends, the two ranked lists, the message-type donut and the heatmap. What you are reading is what people actually said.
Busiest times reads left to right from 12am through 6am, 12pm and 6pm, with a row per day of the week starting on Sunday. It is the card to look at before scheduling anything the whole workspace has to be awake for.
Any card with no data for the chosen period shows No activity in this period in place of the chart. On a brand-new workspace, or on the 7-day range over a quiet week, expect to see several of these at once. It is not an error.
What Analytics is not
- Not a per-user report. Selecting a name in Most active members does nothing; there is no drill-down, no per-person page, and no way to ask what one individual did.
- Not an audit log. HushChat records administrator actions internally, but there is no screen, export or search that reads them back. Who suspended whom, who deleted which message, who disabled a group — none of that is viewable. Analytics and Reports are what exist.
- Not a call log. The Calls tile and the call charts are counts. The Calls tab in the app shows your own call history only, so there is no workspace-wide record of who called whom.
- Not exportable. There is no download, CSV or scheduled report. What is on the screen is what you get.
- Not readable by anyone else. Only workspace administrators can open it.
Where to go next
- Acting on what you find: Reports
- Looking inside a specific group: Manage group chats
- Suspending or removing a person: Company setup, end to end